Master the Pulse of the Market, Trade with Precision — “COE Signals” Indicator Guides You Through the Ocean of Digital Wealth!
sub-bookNavigating the volatile digital financial markets requires a reliable compass to guide your direction. The “[EDU] Close Open Estimation Signals (COE Signals)” is the key you’ve been searching for. Based on an innovative method of estimating opening and closing prices, it provides you with clear buy and sell signals, helping you to gain insights into market fluctuations and capture the essence of every market movement.
Unique Features of the COE Signals Indicator:
- Choice of Data Sources: Supports both “EMA Smoothing” and “Classic” data sources, fulfilling your preference for a smoother data representation or a conventional calculation of differences between closing and opening prices.
- Customizable Lookback Periods: Set your own lookback (default 12), smoothing (default 26), and EMA periods (default 9) to match your trading strategy and market sensitivity.
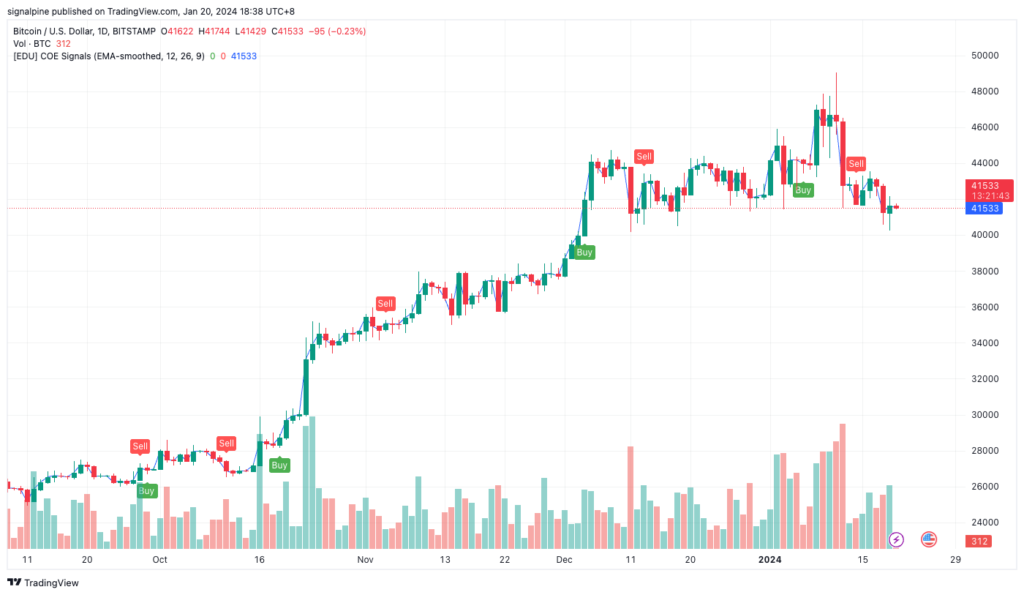
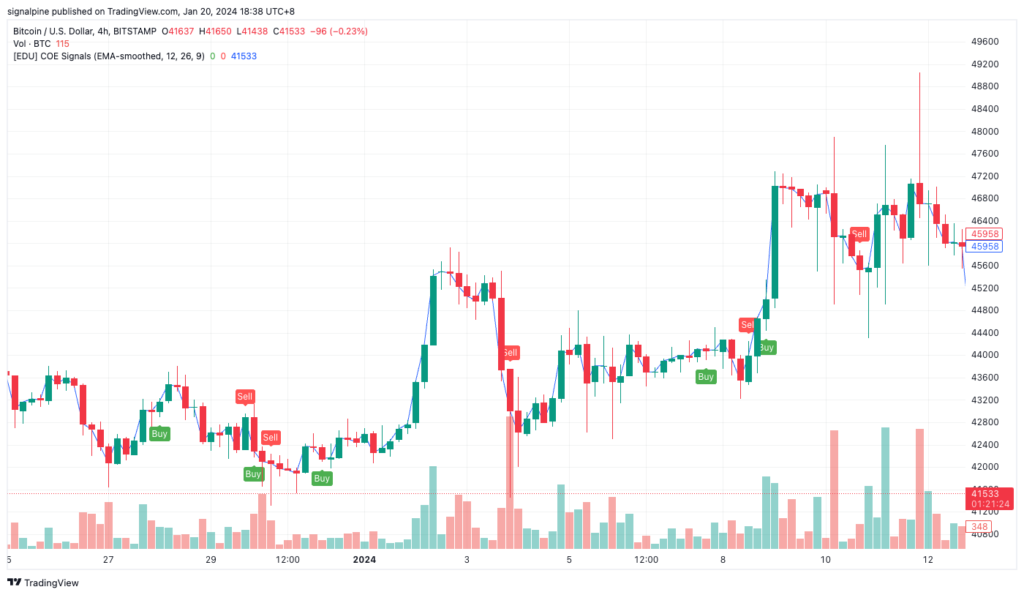
- Intelligent Buy/Sell Signals: When the derivative of the COE fluctuates and crosses occur, buy signals indicate a potential uptrend, while sell signals suggest a potential downtrend.
Why Choose the COE Signals Indicator?
- Advanced Trend Recognition: Combining fast and slow EMA lines, the COE Signals Indicator not only helps you identify the current market trend but also anticipates upcoming market movements.
- Scientific Basis for Trading: Intelligent signal alerts, in conjunction with overbought/oversold CCI signals, provide a scientific support for your trading decisions.
- Personalized Parameter Settings: Adjust the EMA periods according to your individual trading strategy and market sensitivity, completely personalizing your chart setup.
- Intuitive Visual Interface: Clear graphics allow you to capture buy and sell signals at a glance, while color-coded background bars make trend analysis more direct.
How to Transform the COE Signals Indicator into a Powerful Assistant in Your Trading Strategy?
- Integrate the COE Signals Indicator into your chart analysis tools, suitable for fast-paced intraday trading and long-term investment decisions.
- Personalize settings by adjusting the EMA lines to fit your trading style and market perspective, maximizing the potential use of the indicator.
- Pay attention to the buy and sell signals generated by the indicator. When the EMA lines cross and are confirmed by the CCI indicator, you receive strong entry or exit signals.
- With the additional EMA200 line, you can better understand and follow long-term market trends for more stable trading decisions.
- Use the color cues and graphical markers provided by the indicator to quickly identify market turning points and adjust your position strategy accordingly.
The COE Signals Indicator is designed for traders seeking precision, efficiency, and data-driven decisions. It not only enhances your understanding of the market but also facilitates more scientific trading, reducing the influence of emotional decisions.
The road to investment is filled with unknowns, but with the COE Signals Indicator, you can—
Master the Market Pulse, Explore the Art of Trading — “COE Signals” Indicator for Steady Progress! 🚀📊
In the ever-changing trading market, accurate timing often means the difference between profit and loss. We proudly introduce the “[EDU] Close Open Estimation Signals (COE Signals)” indicator, a tool crafted for investors seeking precise market timing. Its unique method of estimating open and close prices provides you with clear buy and sell signals, ensuring a steady journey on the investment path.
Highlights of the COE Signals Indicator:
- Flexible Data Source Options: Offers “EMA Smoothing” and “Classic” modes, allowing you to adjust the data source according to personal preference and accurately capture market dynamics.
- Customizable Configuration: Set your own lookback (default 12), smoothing (default 26), and EMA periods (default 9) to suit your personal trading strategy and market analysis needs.
- Detailed Amplitude Analysis: By calculating the difference in EMA, the COE indicator delves into market fluctuations, revealing the deep logic behind price movements.
Why Is the COE Beacon a Boost to Your Trading Decisions?
- Buy Signals: The appearance of an upward crossing in the derivative EMA signifies a potential rise, pointing out the time to buy.
- Sell Signals: A downward crossing in the derivative EMA suggests a potential fall, sending out a sell prompt.
- Trend Reversal Indication: The crossing behavior of the derivative EMA is akin to changes in higher-order derivatives in mathematics, indicating a potential major trend reversal.
Intuitive Graphical Interface, Quick Decision-Making:
- Clear Buy/Sell Labels: The intuitive “Buy” and “Sell” labels on the graphical interface allow for quick trading decisions.
- Crisp Visuals: Zero-opacity plotting ensures a clean and clear chart, highlighting important information.
 Bitcoin
  Ethereum
  Tether
  XRP
XRP  BNB
BNB  USDC
USDC  Solana
  Figure Heloc
  Dogecoin
  USDS
USDS  WhiteBIT Coin
  Cardano
  LEO Token
  Wrapped stETH
  Hyperliquid
  Bitcoin Cash
  Wrapped Bitcoin
  Binance Bridged USDT (BNB Smart Chain)
  Ethena USDe
  Stellar
  Canton
  Wrapped eETH
  MemeCore
  sUSDS
sUSDS  USD1
USD1  Zcash
Zcash  Litecoin
  Coinbase Wrapped BTC
  Avalanche
  Hedera
  WETH
WETH  Shiba Inu
  Sui
Sui  USDT0
USDT0  Toncoin
  World Liberty Financial
  Bittensor
  Circle USYC
  PAX Gold
  Ethena Staked USDe
  BlackRock USD Institutional Digital Liquidity Fund
  Polkadot
  Global Dollar
  OKB
OKB  Falcon USD
  Pi Network
  Sky
Sky  Aster
Aster  NEAR Protocol
  HTX DAO
  syrupUSDC
  USDD
USDD  Pepe
Pepe  Aave
Aave  Ripple USD
  BFUSD
BFUSD  Ondo US Dollar Yield
  Ondo
Ondo  Janus Henderson Anemoy Treasury Fund
  Gate
Gate  Quant
Quant  KuCoin
  Jupiter Perpetuals Liquidity Provider Token
  Algorand
  Render
  Pump.fun
  Superstate Short Duration U.S. Government Securities Fund (USTB)
  POL (ex-MATIC)
  Jito Staked SOL
  Spiko EU T-Bills Money Market Fund
  USDtb
USDtb  Cosmos Hub
  Binance-Peg WETH
  NEXO
NEXO  Rocket Pool ETH
  Worldcoin
  Binance Bridged USDC (BNB Smart Chain)
  Midnight
  Ethena
  Aptos
Aptos  Function FBTC
  Official Trump
  OUSG
OUSG  Filecoin
  VeChain
  Flare
Flare  syrupUSDT
  YLDS
YLDS  Beldex
  Binance Staked SOL
  Jupiter
  Stable
  Arbitrum
  JUST
JUST  NEW X CEO IS BACK
  Polygon Bridged USDC (Polygon PoS)
  Usual USD
  Solv Protocol BTC
  Artificial Superintelligence Alliance
  Bonk
Bonk  TrueUSD
  clBTC
clBTC  A7A5
A7A5  LayerZero
  Virtuals Protocol
  Siren
Siren  EURC
EURC  Chiliz
  StakeWise Staked ETH
  Pudgy Penguins
  Kinetiq Staked HYPE
  tBTC
tBTC  Janus Henderson Anemoy AAA CLO Fund
  WrappedM by M0
  PRIME
PRIME  c8ntinuum
  Decred
  Mantle Staked Ether
  Kinesis Gold
  ADI
ADI  Polygon PoS Bridged DAI (Polygon POS)
  Ether.fi
  Sun Token
  COCA
COCA  Venice Token
  AINFT
AINFT  Liquid Staked ETH
  Curve DAO
  Arbitrum Bridged WBTC (Arbitrum One)
  Bitcoin SV
  edgeX
edgeX  Wrapped Flare
  USDai
USDai  Monad
Monad  L2 Standard Bridged WETH (Base)
  DoubleZero
  Steakhouse USDC Morpho Vault
  Aerodrome Finance
  Plasma
  Injective
  Kaia
Kaia  Legacy Frax Dollar
  Binance-Peg XRP
  Lido DAO
  Ether.Fi Liquid ETH
  Kinesis Silver
  Conflux
  Official FO
  Noon
Noon  FLOKI
FLOKI  SPX6900
  crvUSD
  Jupiter Staked SOL
  Zebec Network
  Savings USDD
  Celestia
  JasmyCoin
  The Graph
  Marinade Staked SOL
  IOTA
IOTA  Arbitrum Bridged WETH (Arbitrum One)
  Olympus